The web interface for Robot Network is a browser-based tool that uses Fortra Insite to help you access system performance data for your network of IBM i systems from any laptop, tablet, or smartphone. You can also work in the Robot Network Status Center to see and respond to messages and other events that have been escalated to the Robot Network host system.
The architecture of Robot Network web interface uses a “responsive design” so that it adjusts its display based on the hardware technology you are using (see figure 1). It effectively replaces the Robot Network Status Center and Performance Center in the thick client GUI and allows you to access system information using bookmarked links in your favorite browser—so, it’s not an app that needs to be installed on Android or Apple devices.
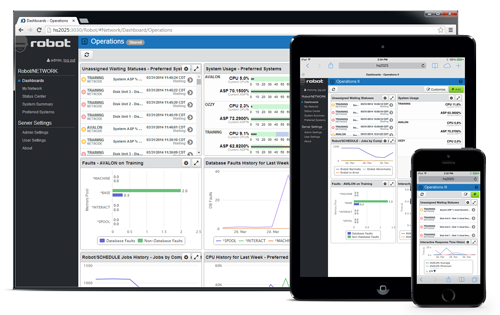
Figure 1 – Robot Network web interface displayed in a browser, on an iPad, and on an iPhone.
A typical configuration of the Help Systems Web Server will see it installed inside your firewall on an appropriate Linux, AIX, or Windows server on the same network as your IBM i. Then, to access the data on a mobile device, you’ll either connect to your network internally using a Wi-Fi connection or externally via a VPN connection. Yes, you can use a VPN client on your tablets and smartphones. Talk to your network administrator to plan for appropriate server resources and mobile access.
Installation and Configuration
There are no Robot Network IBM i component updates required for the web interface. All you need is Robot Network V11 software installed, configured, and running on your IBM i systems to take advantage of the web interface and access the performance or Robot product status data. The Fortra Web Server can be installed on Windows, AIX, or Linux. Follow these prerequisites and instructions for installation:
· Installation for AIX and Linux
During installation, you will be prompted to assign an administrator password. Record this and store it in a safe place as it will be required to configure the interface! Your next steps are to:
- Add a connection to your Robot Network host(s) system.
- Select and configure your authentication method. Authentication for the users will be to an IBM i or an LDAP server. While signed on as Admin, you can associate profiles (under User Settings) to the systems that you want access to in the interface when signed on with the ADMIN user.
- Sign off as administrator then sign on with the username and password as defined in the previous step (IBM i or Robot Network credentials).
- You will initially be directed to assign a profile to each IBM i system you need to access.
- Go to User Settings to set up your preferences. This includes the ability to set your initial view when logging in to the interface, and also to set up an automatic refresh of the Status Center (see figure 2).
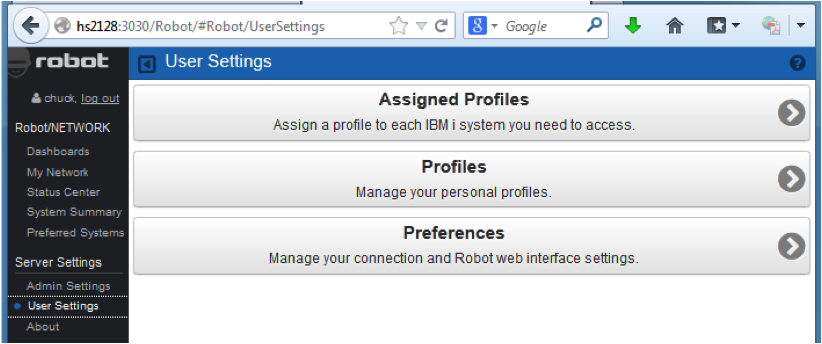
Figure 2 – Configure user settings in Robot Network web interface.
Dashboards
After the basic installation and configuration, you’ll want to take a look at the available dashboard widgets. Select Dashboards, link then +Add. Choose the column formatting and whether you’d like the dashboard to be shared with others (figure 3). After saving the format, you’ll be prompted to choose the widgets you’d like to view in the dashboard.

Figure 3 – Format and customize Robot Network web interface dashboard displays.
You may choose widgets that display the most current performance metrics collected, performance history, and/or Robot product metrics. The Robot Network Status Center is also available in widget format, allowing an easy way to see all the important information about your systems in a single glance. Figure 4 is a sampling of the available dashboard widgets:
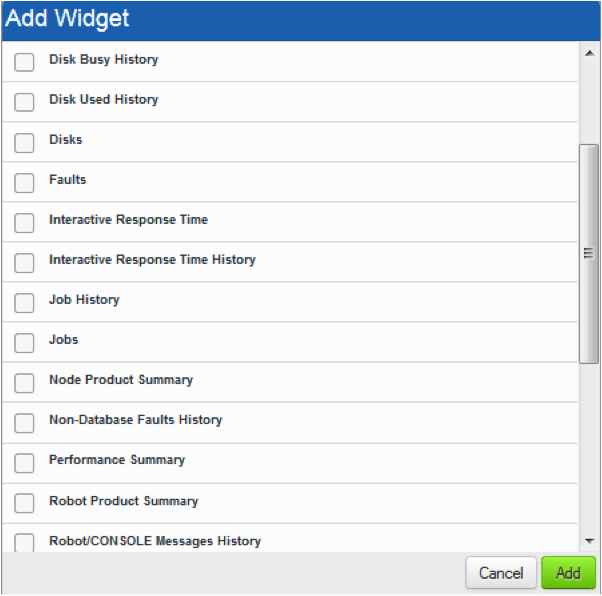
Figure 4 – Select from many widget options in Robot Network web interface.
You can configure your dashboards for automatic refresh, sorting, filtering, graph type, and amount of historical information to display so you get just the information you need (see figure 5). A new feature of this interface allows you to select your preferred systems to be included in the widget display.
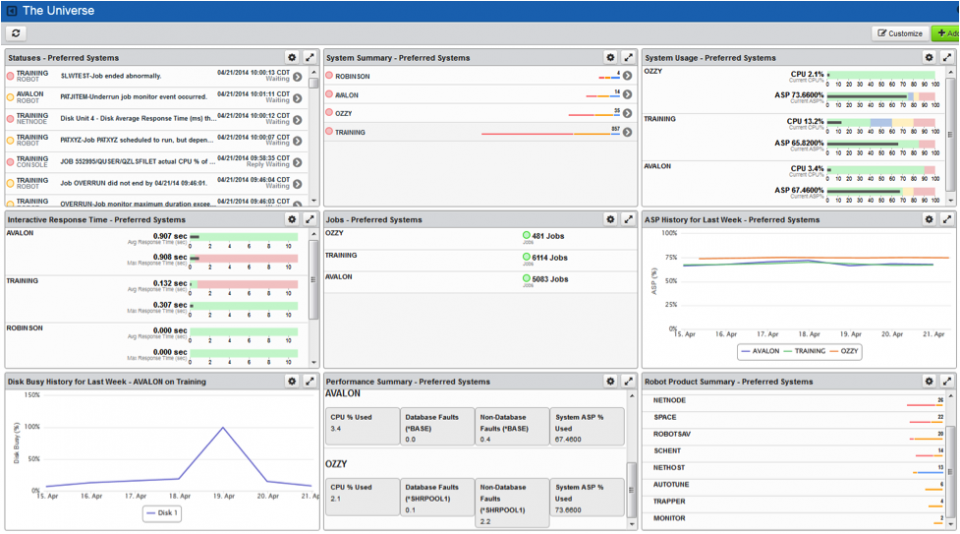
Figure 5 – Robot Network web interface dashboard widgets display your latest data center information.
The performance metrics widgets also have drill-down capability so you can see the details behind the graph to review the individually collected performance statistics (i.e., system status, memory pools, or disk units) for any of the IBM i systems in your network (see figure 6).
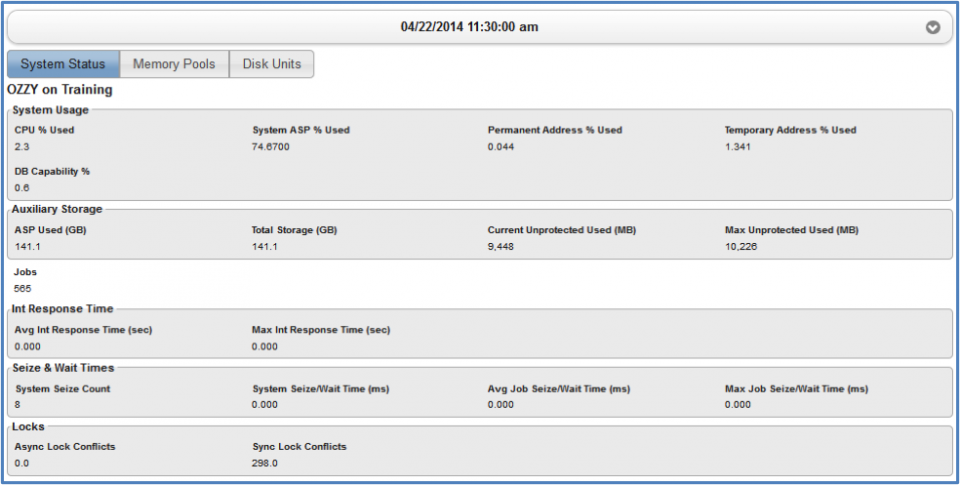
Figure 6 – Performance details for system status, memory pools, or disk units.
Status Center
The web Status Center has all the same features of the GUI Status Center to allow further escalation, reply, acknowledgement, notes, and status assignment. A new feature included in the web Status Center is the ability to group escalated status messages. Statuses are grouped when the text, node system, and product are all identical (see figure 7). This makes it easy to see recurring events and allows all status messages to be acknowledged at the same time!
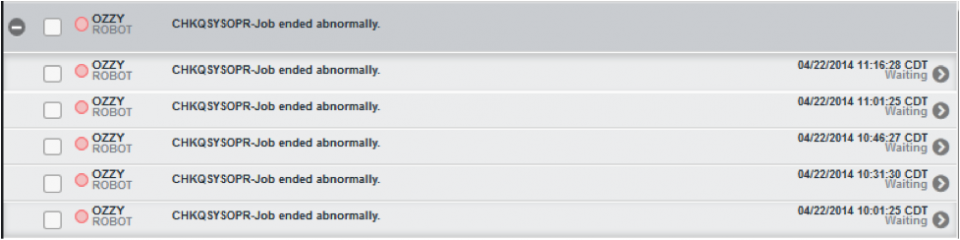
Figure 7 – Grouped status display in Robot Network web interface.
Security
The security settings for Robot Network access in Insite come from the role-based security settings that are already configured in Robot Network. If someone is disallowed from seeing the Status Center, they won’t be able to access it via the web interface. If you only want them to see performance metrics widgets, then set them up to access the Performance Center in the Robot Network GUI.
Get Started
Insite is available for download free from our website to anyone licensed to Robot Network. You can access the Insite download from your My Account page. For folks not yet using the product, you can request a free demo of Robot Network to see the web interface in action.